Tim D Yang![]() 1, Ameya Patil
1, Ameya Patil![]() 2, Yih-Kuen Jan, PT, PhD
2, Yih-Kuen Jan, PT, PhD![]() 1
1
![]() 1Kinesiology and Community Health, Computational Science and Engineering, University of Illinois, Champaign, IL, USA
1Kinesiology and Community Health, Computational Science and Engineering, University of Illinois, Champaign, IL, USA
![]() 2Electrical Engineering, Indian Institute of Technology, Hyderabad, India
2Electrical Engineering, Indian Institute of Technology, Hyderabad, India
ABSTRACT
Power wheelchair users may present secondary impairments that inhibit effective joystick control. Accordingly, driving assessments are needed to ensure the safety of both the drivers and their surroundings. We introduce a quantitative method to evaluate power wheelchair driving performance using the Markov decision process. Our dynamic, stochastic approach supplements previous quantitative evaluations by accounting for individual differences between drivers. For example, a driver who frequently pulls to the left by accident might stay far from the left wall and make extremely wide left turns, but these inefficiencies may actually be appropriate given the context. We include preliminary results to demonstrate this assessment method.
INTRODUCTION
Power wheelchairs provide autonomy and promote self-reliance in people with severe mobility impairments. In 1995, powered mobility devices were used by an estimated 291,000 Americans and exhibited growth trends of 5% per year (LaPlante & Kaye, 2010). Based on these projections, there could be well over a million powered mobility devices in use by 2020. Since power wheelchair users may also present accompanying cognitive, sensory, and motor impairments, driving assessments are needed to ensure the safety of both the drivers and their surroundings.
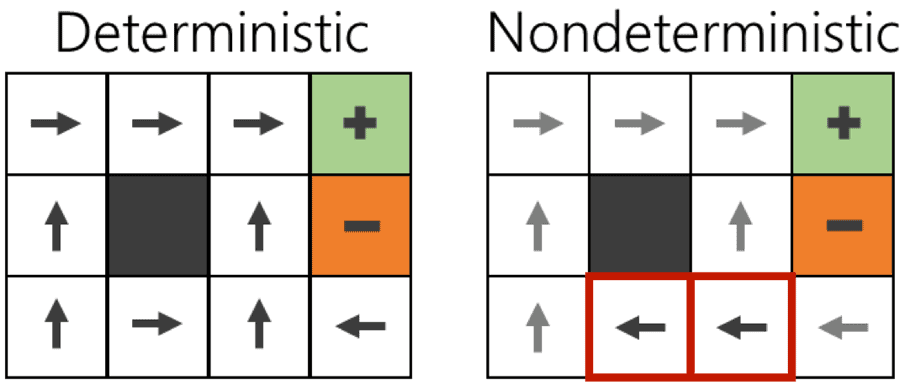 Figure 1: A comparison of deterministic and nondeterministic decisions for reaching the positive block while avoiding the negative block. The nondeterministic agent chooses a longer path to avoid the narrow corridor and to lower the risk hitting the negative block.
Current clinical evaluations are generally qualitative in nature. For example, pediatric wheelchairs are prescribed based on clinical intuition and “trial and error” (Guerette, Tefft, & Furumasu, 2005) or based on assessment batteries, such as the Pediatric Powered Wheelchair Screening Test (Furumasu, Guerette, & Tefft, 2004). For general power wheelchair evaluation, the Wheelchair Skills Test includes a series of common driving tasks that are rated by clinicians (Kirby, Swuste, Dupuis, MacLeod, & Monroe, 2002). To evaluate driving performance more objectively, some studies have begun quantifying joystick metrics with descriptive statistics: reaction time, total driving time, and target accuracy (Dicianno, Spaeth, Cooper, Fitzgerald, & Boninger, 2006); movement error, movement variability, average speed, and average acceleration (Dicianno, Mahajan, Guirand, & Cooper, 2012); and joystick activations, total driving time, and joystick directional variability (Sorrento, Archambault, Routhier, Dessureault, & Boissy, 2011).
However, as a dynamic, stochastic, and nonlinear task (Nechyba & Xu, 1997), human driving contains complexities that are difficult to express with descriptive statistics and ratings. Because driving involves real-time adaptation based on both personal skill and environmental factors, optimal driving decisions are contingent upon each specific individual and the current surroundings. Individual differences (e.g., in fine motor skill) inject nondeterminism into the driving process.
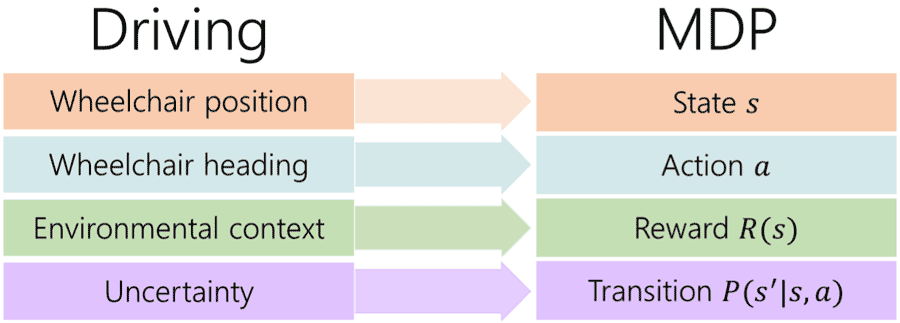 Figure 2: Power wheelchair driving can be mapped as a Markov decision process (MDP), in which the MDP states, actions, reward function, and transition probabilities correspond respectively to wheelchair positions, heading vectors, environmental cues, and driving uncertainty.
To illustrate how this stochastic factor affects optimal control decisions, consider a simplified grid environment in which the goal at any location is to reach the positive block while avoiding the negative block (Figure 1). When a purely deterministic agent makes decisions, those decisions always yield the expected outcome. For example, if it attempts to move forward, it does not have to worry about accidentally moving orthogonally to its left or right. This allows the deterministic agent to use the shortest path distance to its goal. However, when a nondeterministic agent makes decisions, those decisions do not always yield the expected outcome. In this example, the agent has a high probability of moving orthogonally against its intended direction, so it avoids the narrow corridor rather than taking the risk of accidentally falling into the orange block. Although this results in a longer path distance, the nondeterministic agent is still making optimal decisions within the context of its personal skill and situational environment. In stochastic scenarios such as this, the optimal decision always involves a careful balance between the movement probabilities and movement rewards. This type of stochastic decision optimization problem can be formalized as a first-order Markov decision process (MDP).
METHODS
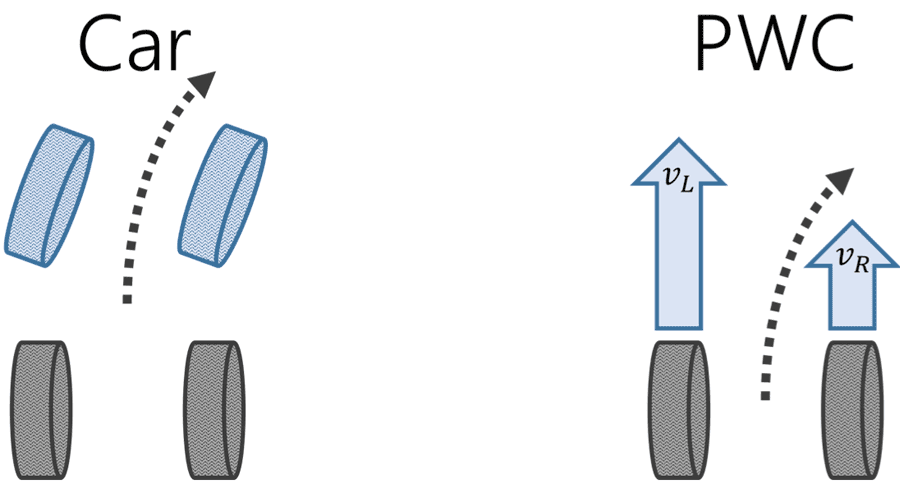 Figure 3: In a modern car, differential gears allow its wheels to freely adapt to the needed speeds when negotiating turns. On the other hand, a power wheelchair’s wheels turn via differential steering, such that each wheel’s velocity is explicitly governed.
The MDP framework (Russell & Norvig, 2009) consists of a set of states (e.g., wheelchair positions), set of actions (e.g., wheelchair heading vectors), probability distribution of movement transitions (e.g., movement uncertainty), and reward function (e.g., environmental cues) (Figure 2). These components allow us to model the task of driving as a sequence of MDP decisions, accounting for differences in driving skill and environmental contexts. We then develop an individualized performance measure by comparing the driver’s actual actions with those computed from the MDP.
Mapping Wheelchair Headings into MDP Actions
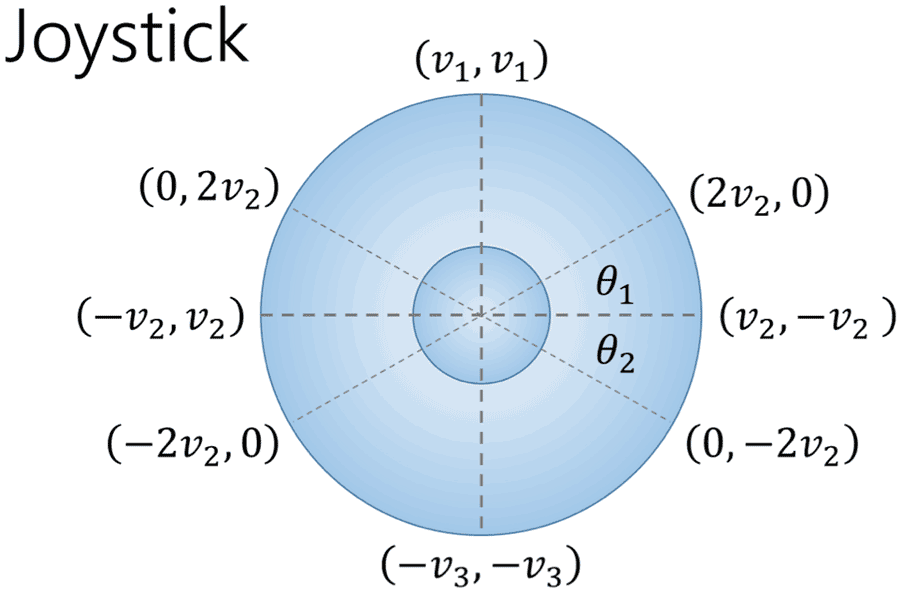 Figure 4: An overhead diagram of the joystick. The joystick’s Cartesian coordinates were mapped to pairs of wheel velocities based on the output voltages. The values for v
Unlike cars which turn via differential gearing, power wheelchairs turn via differential steering (Figure 3), such that each wheel’s velocity is explicitly governed. For example, the power wheelchair turns to the right by making the left wheel rotate faster than the right wheel. To estimate the driver’s actions, joystick positions are first mapped into wheel velocities (Figure 4) and then converted into heading vectors using rigid body mechanics.
Mapping Uncertainty into MDP Transition Probabilities
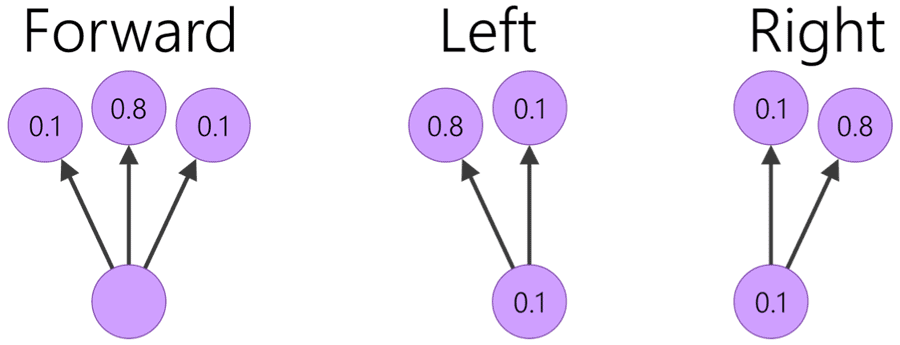 Figure 5: The transition model used in this study. The values represent movement probabilities when attempting to move left, forward, and right.
Driving is a stochastic process in large part because the result of each decision is always uncertain. Intended decisions do not perfectly manifest themselves in the physical domain, especially for people with impaired fine motor control. The transition probabilities represent an individualized model for a person’s driving tendencies. For this preliminary report, we use a simulated transition model, such that the driver is assumed to have an 80% probability of completing the intended action (Figure 5).
Mapping Environmental Context into MDP Rewards
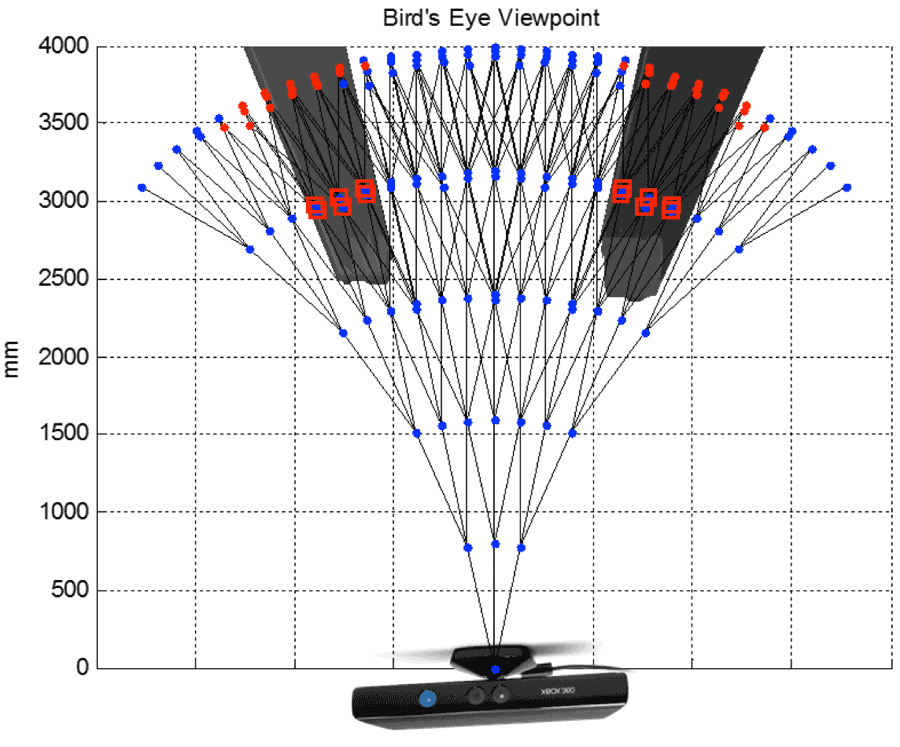 Figure 6: An overhead depth image of two obstacles. The graph is overlaid on the depth image. All graph nodes of obstacles and their children are assigned negative values, inversely weighted by the distance from the sensor.
We use the Kinect sensor (Microsoft Corporation, Redmond, WA) to sense the environment. The Kinect captures color and depth images within a 57° horizontal field of view and 4,000 mm radial distance. Based on the joystick actions and movement transitions, we model the MDP’s states as a 3-branch, 6-depth graph (Figure 6). Each branch represents one of the three joystick actions (left, middle, right) that can be chosen at a given state
Optimizing the MDP Policy
In the MDP framework, decisions can be optimized into a policy of actions that maximizes the agent’s expected utility using a simplified Bellman equation (Equation 1). Optimization of the utility values is performed using backward induction (Russell & Norvig, 2009).
U(s) = R(s) + max![]() a Σ
a Σ![]() s'P(s'|s,a)U(s') (1)
s'P(s'|s,a)U(s') (1)
Equation 1: U(s) is the utility value for a state s, R(s) is the reward for a state s, and P(s'|s,a) is the transition probability of reaching state s' given the current state s and action a.
Assessing the Driving Performance
Although the backward induction algorithm computes a utility-optimal policy, there is nothing inherently wrong with suboptimal decisions. Mathematically, it simply means that the driver can no longer achieve the highest possible utility. Practically, the impact could range anywhere from negligible to catastrophic. The severity of the deviations can be quantified in terms of the resulting expected utility.
At the root node of each graph, the computed and observed actions are compared based on their resulting expected utilities. A risk index is calculated by normalizing the utility difference against the optimal utility (Equation 2). Thus, when the computed and observed actions match, the risk index evaluates to zero; otherwise, riskier mismatches evaluate to higher values.
I(t) = [U![]() Obs(t) - U
Obs(t) - U![]() MDP (t)]/U
MDP (t)]/U![]() MDP(t) (2)
MDP(t) (2)
Equation 2: I(t) is the risk index at time t, U![]() Obs(t) is the utility value of the observed action at the root node at time t, and U
Obs(t) is the utility value of the observed action at the root node at time t, and U![]() MDP(t) is the utility value of the MDP action at the root node at time t.
MDP(t) is the utility value of the MDP action at the root node at time t.
RESULTS
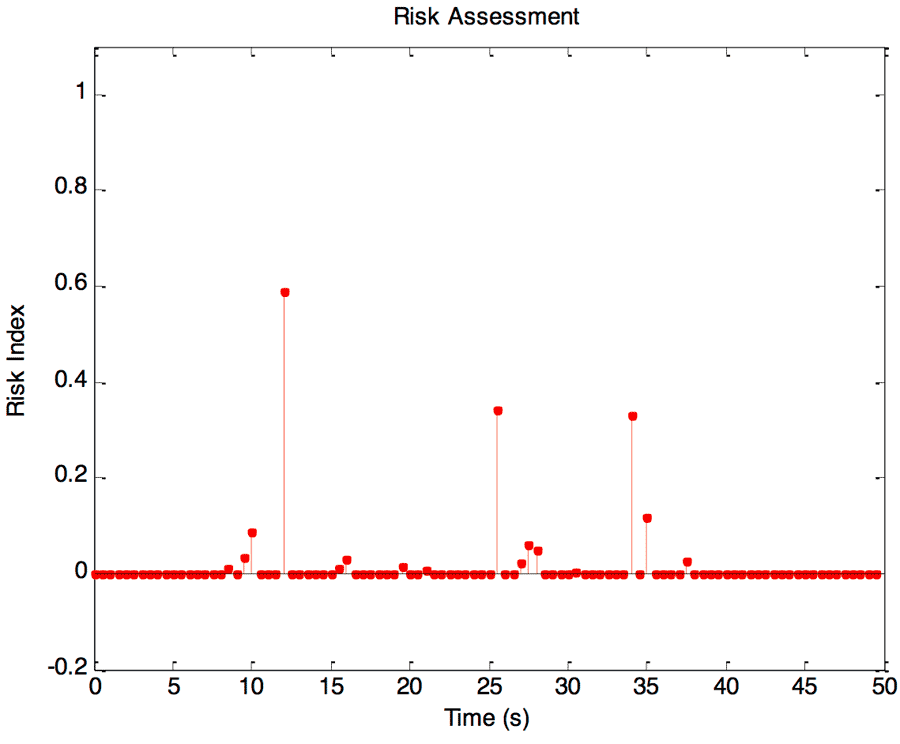 Figure 7: Risk indices from a sample driving trial.
We performed preliminary experiments on a C400 power wheelchair (Permobil, Inc., Lebanon, TN). Figure 7 presents a selected time series of the calculated risk indices. Sample camera images, which have been superimposed with computed and observed heading vectors, are shown for both high-risk (Figures 8) and low-risk (Figure 9) situations.
DISCUSSION
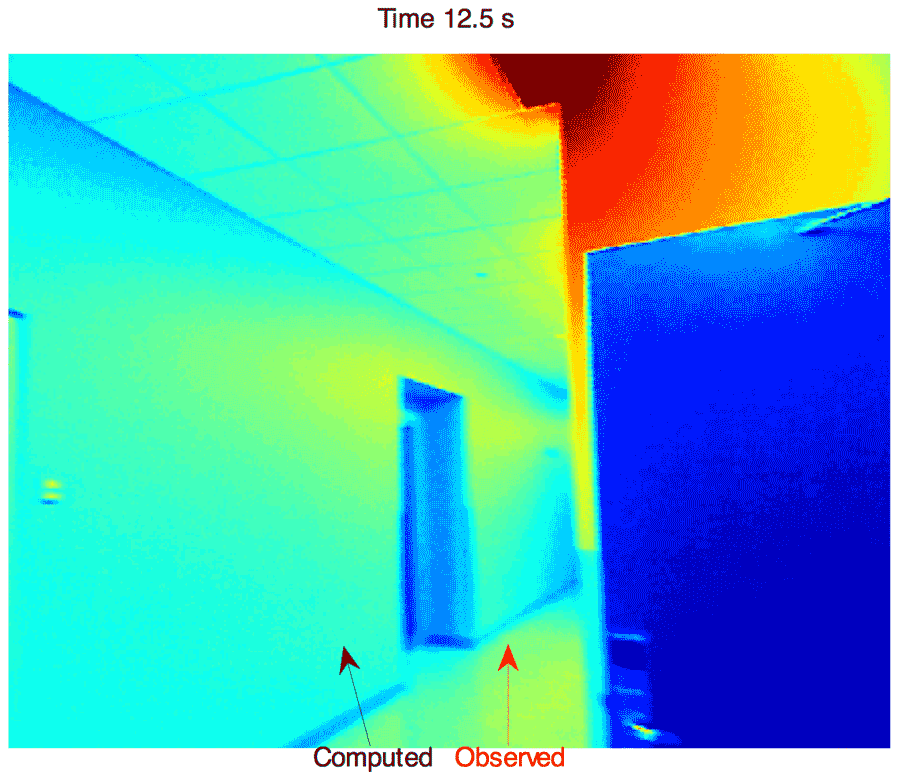 Figure 8: Example of a high risk index (0.59), occurring at t=12.5 s.
We used a simulated transition model that assumed the driver to possess a relatively high probability (20%) of mistakenly moving to the right or left of each intended direction. Figure 8 shows an example of a high-risk mismatch between the computed MDP action (move left) and the observed action (move forward). For an able-bodied driver, the observed action might not be considered risky. However, the MDP was provided a simulated model of a relatively unpredictable driver, causing the optimization algorithm to compute a left action. For such a driver, attempting to move straight might accidentally cause the driver to move to the right and collide with the extremely proximate door. Figure 9 illustrates another mismatch. Again, the MDP accounted for the model’s driving uncertainty and computed a conservative optimal policy to perform a right turn away from the wall. However, the risk index was negligible. In this case, the wall was more distant than in Figure 8, so the expected utility difference between the mismatched actions was lower. These examples illustrate the model’s ability to account for both driving tendencies and environmental cues.
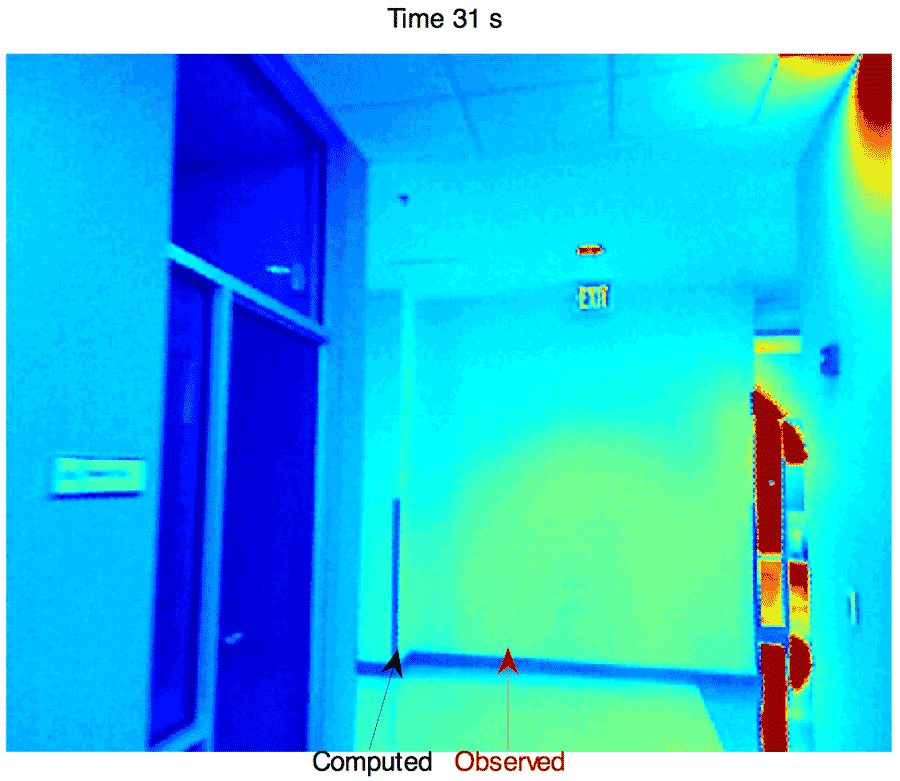 Figure 9: Example of a low risk index (0.01), occurring at t = 31 s.
Although our reported examples focused on driving decisions, the value of individualized driving evaluation extends beyond the explicit path decisions. For example, a driver may actually be executing optimal driving decisions, even if the joystick activation counts or driving durations are not absolutely minimal. As depicted earlier in the simplified grid example, optimal paths may be altered significantly based on a driver’s tendencies. Perhaps a driver, caregiver, or clinician has noticed that the driver frequently pulls to the left accidentally. Such a driver might instinctively stay farther from the left wall and/or make extremely wide left turns, but these inefficiencies may actually be desirable.
Our MDP quantification method provides awareness of situational context (i.e., reward function via the Kinect data) and individual differences (i.e., transition model). In this study, we used a simulated transition model as a demonstration of the method. In future work, we plan to empirically estimate the transition model of each driver’s joystick control, allowing the MDP to compute individualized optimal policies as a reference to evaluate each driver’s performance.
REFERENCES
Dicianno, B. E., Mahajan, H., Guirand, A. S., & Cooper, R. A. (2012). Virtual electric power wheelchair driving performance of individuals with spastic cerebral palsy. Am J Phys Med Rehabil, 91(10), 823-830. doi: 10.1097/PHM.0b013e31825a1497
Dicianno, B. E., Spaeth, D. M., Cooper, R. A., Fitzgerald, S. G., & Boninger, M. L. (2006). Advancements in power wheelchair joystick technology: Effects of isometric joysticks and signal conditioning on driving performance. Am J Phys Med Rehabil, 85(8), 631-639. doi: 10.1097/01.phm.0000228519.54763.b4
Furumasu, J., Guerette, P., & Tefft, D. (2004). Relevance of the Pediatric Powered Wheelchair Screening Test for children with cerebral palsy. Developmental Medicine & Child Neurology, 46, 468-474.
Guerette, P., Tefft, D., & Furumasu, J. (2005). Pediatric powered wheelchairs: results of a national survey of providers. Assist Technol, 17(2), 144-158. doi: 10.1080/10400435.2005.10132104
Kirby, R. L., Swuste, J., Dupuis, D. J., MacLeod, D. A., & Monroe, R. (2002). The Wheelchair Skills Test: A pilot study of a new outcome measure. Arch Phys Med Rehabil, 83(1), 10-18. doi: 10.1053/apmr.2002.26823
LaPlante, M. P., & Kaye, H. S. (2010). Demographics and trends in wheeled mobility equipment use and accessibility in the community. Assist Technol, 22(1), 3-17; quiz 19. doi: 10.1080/10400430903501413
Nechyba, M. C., & Xu, Y. (1997). Human control strategy: Abstraction, verification, and replication. IEEE Control Systems, 17(5), 48-61.
Russell, S. J., & Norvig, P. (2009). Artificial intelligence: a modern approach (3rd edition): Prentice Hall.
Sorrento, G. U., Archambault, P. S., Routhier, F., Dessureault, D., & Boissy, P. (2011). Assessment of joystick control during the performance of powered wheelchair driving tasks. Journal of NeuroEngineering and Rehabilitation, 8, 31-41.
ACKNOWLEDGMENTS
We thank Permobil, Inc. for providing the power wheelchair and the SN Bose Scholars Program for facilitating scientific collaboration between the US and India. Please address all correspondence to Dr. Yih-Kuen Jan (yjan@illinois.edu).
Audio Version PDF Version